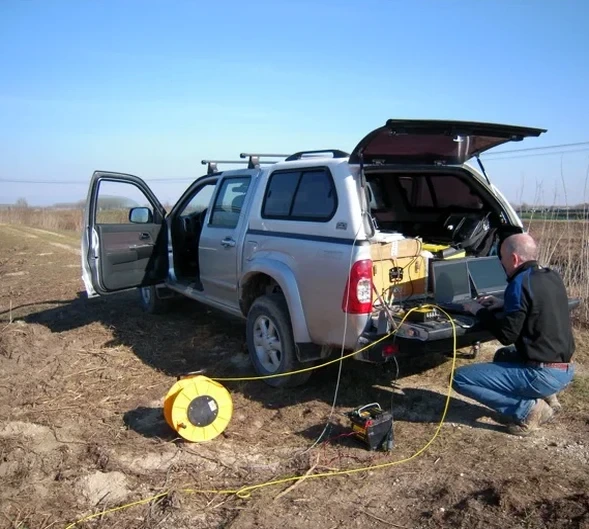
Milton Keynes sits at roughly 105 metres above sea level on a thick sequence of Jurassic clays and limestone, where the bedrock topography can shift dramatically over short distances. The 2022 MK East expansion masterplan alone covers over 460 hectares of greenfield land, much of it underlain by the Great Oolite Group with variable weathering profiles that boreholes often miss between grid points. Seismic tomography (refraction/reflection) bridges that gap. Rather than inferring stratigraphy from isolated cores, the method maps compressional and shear wave velocity across entire cross-sections, revealing hidden dissolution features, buried channels, and the true depth to competent limestone. For engineers working across Milton Keynes, this means fewer surprises once the excavators arrive—and a ground model that actually reflects what is down there. When combined with targeted intrusive techniques like CPT testing in areas where velocity contrasts indicate soft infill, the subsurface image becomes remarkably clear.
Seismic velocity is the one parameter that directly links geophysics to geotechnics—every modulus you need starts there.
Quick answers
How deep can a seismic refraction survey image on a typical Milton Keynes site?
Depth of investigation depends primarily on the length of the geophone spread and the velocity structure of the ground. A 100-metre spread on Oxford Clay and limestone, with velocities typically ranging from 600 m/s in weathered Head to over 3,000 m/s in competent Blisworth Limestone, will generally resolve down to 20 to 25 metres. Longer spreads or reflection techniques can push the image deeper, which is useful when investigating the transition into the Rutland Formation or assessing potential dissolution at depth.
What does a seismic refraction and reflection survey cost in the Milton Keynes area?
For a single refraction line of roughly 100 to 150 metres with standard processing, the cost typically ranges from £2,480 to £4,370 depending on access conditions, array length, and whether reflection processing is added. Sites requiring multiple intersecting lines, traffic management, or full-waveform inversion will sit toward the upper end. We provide a fixed-price proposal once the line layout and target depth are defined.
How does seismic tomography complement boreholes and CPTs on a Milton Keynes site?
Boreholes and CPTs give you precise data at a point; seismic tomography gives you the picture between those points. On a Milton Keynes commercial site, you might drill four boreholes and push two CPTs, then run a refraction line connecting them. The velocity tomogram shows whether the limestone surface is planar or undulating, whether low-velocity zones suggest deeper weathering or a buried channel, and where to expect material boundaries that the borehole logs only sampled at discrete intervals. It turns a sparse dataset into a continuous ground model.
Can seismic methods detect voids in the limestone beneath Milton Keynes?
Yes, voids and collapse features produce a characteristic low-velocity anomaly that seismic refraction and reflection can identify, provided the feature is large enough relative to its depth. Air-filled cavities in the Cornbrash or Blisworth Limestone create a sharp velocity contrast—sometimes dropping from over 2,500 m/s in intact rock to below 1,200 m/s across a weathered chimney. Reflection sections may also show disrupted or sagging reflectors above a void. The technique is not a substitute for targeted drilling, but it is the most effective screening tool for reducing the chance of missing a cavity between boreholes.